 Investment Team Voices Home Page
Investing for Growth: Understanding the Value of Disruption
March 27, 2024
Global Growth Versus Global Value
The MSCI ACWI Growth Index has beaten the MSCI ACWI Value Index since inception—7.79% versus 6.72% on an annualized basis, and 670% versus 488% compounded.
Growth has outperformed value for 65% of rolling 5-year periods at year-end intervals, with average outperformance of 7.33%.
Past performance is no guarantee of future results. Source: Bloomberg. Data is from 12/31/96, the earliest common inception date of the indexes through 3/14/24.
It’s well understood that growth and value investment styles cycle in and out of favor over the short term. As long-term investors, we are dedicated to sticking to our knitting—maintaining style purity—and we are unapologetically growth oriented because we believe a growth focus produces the best long-term outcomes.
Our conviction in growth reflects our philosophical belief that over the long term, disruption and innovation drive investment opportunity. Of course, not all innovation is equally disruptive, and valuations always matter. Our job as portfolio managers is to understand how a company’s growth potential aligns with its valuation. Disruptions that are truly extraordinary can warrant higher valuations in the short term.
Opportunity cost of global value stocks, aka, “When is growth the better value?”
The higher EPS growth of growth stocks can make up for a higher P/E ratio
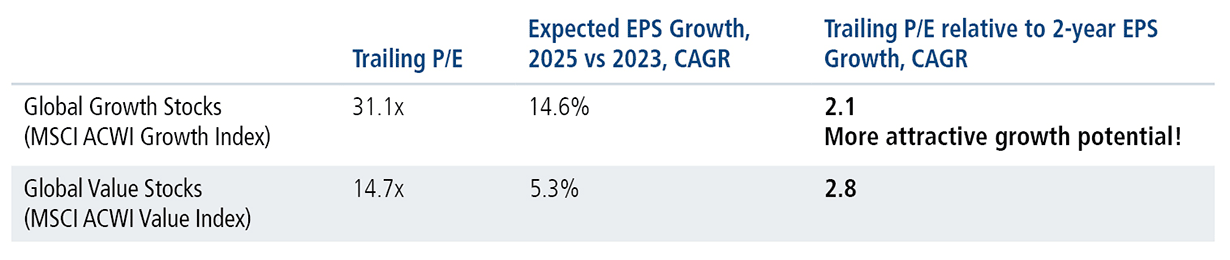
Past performance is no guarantee of future results. Data as of 3/14/24. Source: Bloomberg. Expected earnings per share (EPS) growth, CAGR is measures expectations for a company’s earnings growth per share, with higher values indicating higher expected growth. The trailing price-to-earnings ratio represents the current stock price divided by earnings per share over the trailing 12 months.
Learn more about the Calamos Global and International Funds
Calamos Global Opportunities Fund (CGCIX)
Calamos Evolving World Growth Fund (CNWIX)
This is where research and a willingness to chart our own course makes all the difference. Identifying the most lucrative disruptions often leads us to what are—at least in the moment—niche areas that are underrepresented in benchmarks, overlooked by peers, or underreported in the headlines.
High-conviction growth investing in focus: India’s real estate sector
For quite a while, our team has been bullish on India’s equity market. Over the years, we’ve found an array of companies benefiting from the country’s economic reforms, demographics, and secular and cyclical themes, like friendshoring.
More recently, global investors have come to appreciate India’s growth story, and the market as a whole has enjoyed a strong run. Indian equities as measured by the MSCI India Index have gained 39.4% over the past year, strongly outperforming the global equity market as measured by the MSCI ACWI Index’s return of 27.5% (data as of March 14, 2024).
Some might argue that India is optically expensive today, and a value manager would likely have a hard time entering the Indian equity market. But, as growth investors, we can be more open minded and forward looking. While valuations are higher than when we first established our bullish case, we believe there are still select industries and companies where longer-term growth opportunities exist.
We see a “once in a lifetime” opportunity
![]()
Macrotech Developers Ltd/Lodha Group is a $10 billion property developer focused on residential and digital infrastructure projects.
Top-down growth drivers: Demographics and economic reform
By 2030, we expect:
- India’s economy will more than double in size to $7-$8 trillion.
- Real estate’s contribution to that growth is likely to grow by more than 5x to $1 trillion—approximately 15% of GDP.
- The residential property market is in the early stages of a multi-year upcycle.
- The number of households able to purchase homes is likely to double to 175 million.
Bottom-up drivers: Sound strategy and quality fundamentals
Lodha is:
- The leading brand and largest landbank in the attractive Mumbai Metropolitan Region.
- Developing two large townships strategically positioned in the eastern suburbs of Mumbai.
- Expanding into new metro markets with attractive long-term outlooks.
- Building an infrastructure portfolio of facilities catering to the digital economy.
- Utilizing more capital-light joint developments, which should translate to higher returns over time.
These include India’s real estate sector, which we believe is in a unique situation today that likely only occurs once in a country’s history. Favorable demographics, prudent regulatory policy, and advantageous supply chains have combined to create investment opportunities that we believe will produce above-average returns well into the next decade for select companies. For this reason, we’re comfortable taking on higher valuations when individual company fundamentals warrant. (See the sidebar for a snapshot of Macrotech Developers Ltd/Lodha Group, a company we believe is positioned to capitalize on these trends and is held across the Calamos global and international suite.*)
Charting our own course
The way we allocate to India also illustrates another key element of our high-conviction approach. While we are benchmark aware, we are not benchmark constrained. Our security selection is driven by our conviction in our research and not based on where our indexes or peers are invested.
The MSCI India Index, for example, is heavily weighted toward Indian banking stocks rather than real estate. However, Indian banking is an area where we don’t believe current valuations and long-term growth potential align favorably—in fact, our global and international funds currently have no exposure to Indian banking stocks.
Conclusion
A research-driven, risk-aware discipline has served us well over the long term, and we’re excited about what we see ahead. We believe our portfolios are well positioned to benefit not only from thematic opportunities and individual security selection but also from continued global economic expansion and declining inflation—tailwinds that could be sustained for years to come.
Before investing, carefully consider the fund’s investment objectives, risks, charges and expenses. Please see the prospectus and summary prospectus containing this and other information which can be obtained by calling 1-866-363-9219. Read it carefully before investing.
The opinions referenced are as of the date of publication and are subject to change due to changes in the market or economic conditions and may not necessarily come to pass. Information contained herein is for informational purposes only and should not be considered investment advice. References to specific securities, asset classes and financial markets are for illustrative purposes only and are not intended to be, and should not be interpreted as recommendations.
This material is distributed for informational purposes only. The information contained herein is based on internal research derived from various sources and does not purport to be statements of all material facts relating to the information mentioned and, while not guaranteed as to the accuracy or completeness, has been obtained from sources we believe to be reliable.
The Calamos Global and International mutual fund suite includes Calamos Evolving World Growth Fund, Calamos Global Opportunities Fund, Calamos Global Equity Fund, Calamos International Growth Fund, Calamos International Small Cap Growth Fund.
As of 12/31/2024, the largest holdings in Calamos Evolving World Growth Fund are as follows: Taiwan Semiconductor Mfg, 8.3%; SK Hynix, Inc., 5.2%; MakeMyTrip, Ltd., 5.0%; Corp Inmobiliaria Vesta SAB de CV, 3.2%; Tencent Holdings, Ltd., 2.9%; Li Auto, Inc., 2.7%; MercadoLibre, Inc., 2.6%; Alchip Technologies, Ltd., 2.5%; Macrotech Developers, Ltd., 2.3%; Hindustan Aeronautics, Ltd, 2.2%. As of 1/31/24, Macrotech Developers represented 2.60% of investments.
As of 12/31/2024, the largest holdings in Calamos International Small Cap Growth Fund are as follows: Munters Group, AB, 4.7%; Gerresheimer, AG,4.6%; DO & Company, AG, 4.4%: Melrose Industries, PLC, 3.9%; Corp Inmobiliaria Vesta SAB de CV, 3.1%; Stantec, Inc., 3.1%; Alchip Technologies, Ltd., 2.8%; BE Semiconductor Industries, NV, 2.6%; SHIFT, Inc., 2.6%; Ashtead Technology Holdings, PLC, 2.5%. As of 1/31/24, Macrotech Developers represented 1.65% of investments.
As of 12/31/2024, the largest holdings in Calamos Global Opportunities Fund are as follows: NVIDIA Corp., 4.4%; Microsoft Corp., 4.4%; Novo Nordisk A/S (ADR), 3.5%; Eli Lilly & Company, 3.1%; Eni S.p.A., 3.0%; Apple, Inc., 2.9%; MakeMyTrip, Ltd., 2.6%; Taiwan Semiconductor Mfg, 2.3%; Alphabet, Inc. - Class A, 2.2%; Uber Technologies, Inc., 2.1%. As of 1/31/24, Macrotech Developers represented 0.61% of investments.
As of 12/31/2024, the largest holdings in Calamos Global Equity Fund are as follows: NVIDIA Corp., 5.6%; Microsoft Corp., 5.3%; Novo Nordisk A/S (ADR), 4.1%; Eli Lilly & Company, 3.8%; Amazon.com, Inc., 3.5%; Canadian Natural Resources, Ltd., 3.1%; Apple, Inc., 3.1%; Alphabet, Inc. - Class A, 2.5%; ASML Holding, NV, 2.3%; Micron Technology, Inc., 2.0%. As of 1/31/24, Macrotech Developers represented 0.85% of investments.
As of 12/31/2024, the largest holdings in Calamos International Growth Fund are as follows: Novo Nordisk A/S, 5.7%; Rolls-Royce Holdings, PLC, 3.5%; Advantest Corp., 3.2%; ASML Holding, NV, 3.1%; Shopify, Inc. - Class A, 3.0%; Gerresheimer, AG, 2.7%; Taiwan Semiconductor Mfg, 2.5%; Stantec, Inc., 2.5%; Constellation Software Inc/Canada, 2.5%; MercadoLibre, Inc.,2.4%. As of 1/31/24, Macrotech Developers represented 1.21% of investments.
Holdings and weightings are subject to change daily. Holdings are provided for informational purposes only and should not be deemed as a recommendation to buy or sell the securities mentioned. Top 10 Holdings and Sector Weightings are calculated as a percentage of net assets and exclude cash or cash equivalents, any government / sovereign bonds or broad-based index hedging securities the portfolio may hold. You can obtain a complete listing of holdings by visiting www.calamos.com.
Indexes are unmanaged, do not include fees and expenses, and are not available for direct investment. The MSCI ACWI Growth Index captures large and mid cap securities exhibiting overall growth style characteristics across 23 Developed Markets (DM) countries and 24 Emerging Markets (EM) countries. The MSCI ACWI Value Index captures large and mid cap securities exhibiting overall growth style characteristics across 23 Developed Markets (DM) countries and 24 Emerging Markets (EM) countries. The MSCI India Index measures large and mid cap segments of the Indian equity market.
An investment in the Fund(s) is subject to risks, and you could lose money on your investment in the Fund(s). There can be no assurance that the Fund(s) will achieve its investment objective. Your investment in the Fund(s) is not a deposit in a bank and is not insured or guaranteed by the Federal Deposit Insurance Corporation (FDIC) or any other government agency. The risks associated with an investment in the Fund(s) can increase during times of significant market volatility. The Fund(s) also has specific principal risks, which are described below. More detailed information regarding these risks can be found in the Fund's prospectus.
The principal risks of investing in the Calamos Evolving World Growth Fund include: equity securities risk consisting of market prices declining in general, growth stock risk consisting of potential increased volatility due to securities trading at higher multiples, foreign securities risk, emerging markets risk, convertible securities risk consisting of the potential for a decline in value during periods of rising interest rates and the risk of the borrower to miss payments, and portfolio selection risk. As a result of political or economic instability in foreign countries, there can be special risks associated with investing in foreign securities, including fluctuations in currency exchange rates, increased price volatility and difficulty obtaining information. In addition, emerging markets may present additional risk due to potential for greater economic and political instability in less developed countries.
The principal risks of investing in the Calamos Global Equity Fund include: equity securities risk consisting of market prices declining in general, growth stock risk consisting of potential increased volatility due to securities trading at higher multiples, value stock risk, foreign securities risk, forward foreign currency contract risk, emerging markets risk, small and mid-sized company risk and portfolio selection risk. As a result of political or economic instability in foreign countries, there can be special risks associated with investing in foreign securities, including fluctuations in currency exchange rates, increased price volatility and difficulty obtaining information. In addition, emerging markets may present additional risk due to potential for greater economic and political instability in less developed countries.
The principal risks of investing in the Calamos International Growth Fund include: equity securities risk consisting of market prices declining in general, growth stock risk consisting of potential increased volatility due to securities trading at higher multiples, foreign securities risk, emerging markets risk, small and mid-sized company risk and portfolio selection risk. As a result of political or economic instability in foreign countries, there can be special risks associated with investing in foreign securities, including fluctuations in currency exchange rates, increased price volatility and difficulty obtaining information. In addition, emerging markets may present additional risk due to potential for greater economic and political instability in less developed countries.
The principal risks of investing in the Calamos Global Opportunities Fund include: convertible securities risk consisting of the potential for a decline in value during periods of rising interest rates and the risk of the borrower to miss payments, synthetic convertible instruments risk consisting of fluctuations inconsistent with a convertible security and the risk of components expiring worthless, foreign securities risk, emerging markets risk, equity securities risk, growth stock risk, interest rate risk, credit risk, high yield risk, forward foreign currency contract risk, portfolio selection risk, and liquidity risk. As a result of political or economic instability in foreign countries, there can be special risks associated with investing in foreign securities, including fluctuations in currency exchange rates, increased price volatility and difficulty obtaining information. In addition, emerging markets may present additional risk due to potential for greater economic and political instability in less developed countries.
The principal risks of investing in the Calamos International Small Cap Growth Fund include: equity securities risk consisting of market prices declining in general, growth stock risk consisting of potential increased volatility due to securities trading at higher multiples, foreign securities risk, emerging markets risk, small and mid-sized company risk and portfolio selection risk. As a result of political or economic instability in foreign countries, there can be special risks associated with investing in foreign securities, including fluctuations in currency exchange rates, increased price volatility and difficulty obtaining information. In addition, emerging markets may present additional risk due to potential for greater economic and political instability in less developed countries. The Fund invests in small capitalization companies, which are often more volatile and less liquid than investments in larger companies.
024012 0324