
Does the world still have a problem with debt? The common conviction among investors is that “too much debt” is why we face a future of secular stagnation. And yet, seven years after the Great Financial Crisis, is it time to move on from these fears?
Balance sheet analysis can be complicated and one complication is the relevant context for judging “too much debt.” For example, should we compare debt to assets, net worth, or income? Or should we focus on the carrying cost of debt such as interest expense relative to income?
The good news is that regardless of the approach, U.S. households (consumers) and the U.S. business sector appear in respectable shape. Figure 1a and 1b suggest that the U.S. private sector no longer faces a headwind from excessive levels of indebtedness. To quote Ray Dalio, the private sector has “beautifully de-leveraged” * from both a consumer and business perspective.
Figure 1a. Debt/Net Worth of the Private Sector Quarterly Data, 3/31/1952 to 12/31/2015
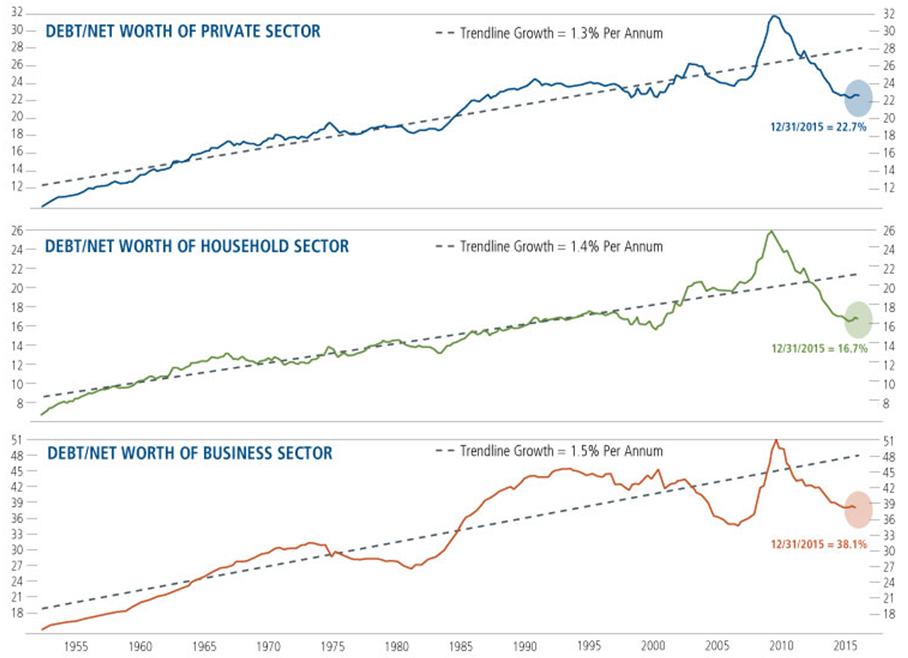
Figure 1b. Household Debt Service and Financial Obligation Ratios Quarterly Data, 3/31/1980 to 12/31/2015
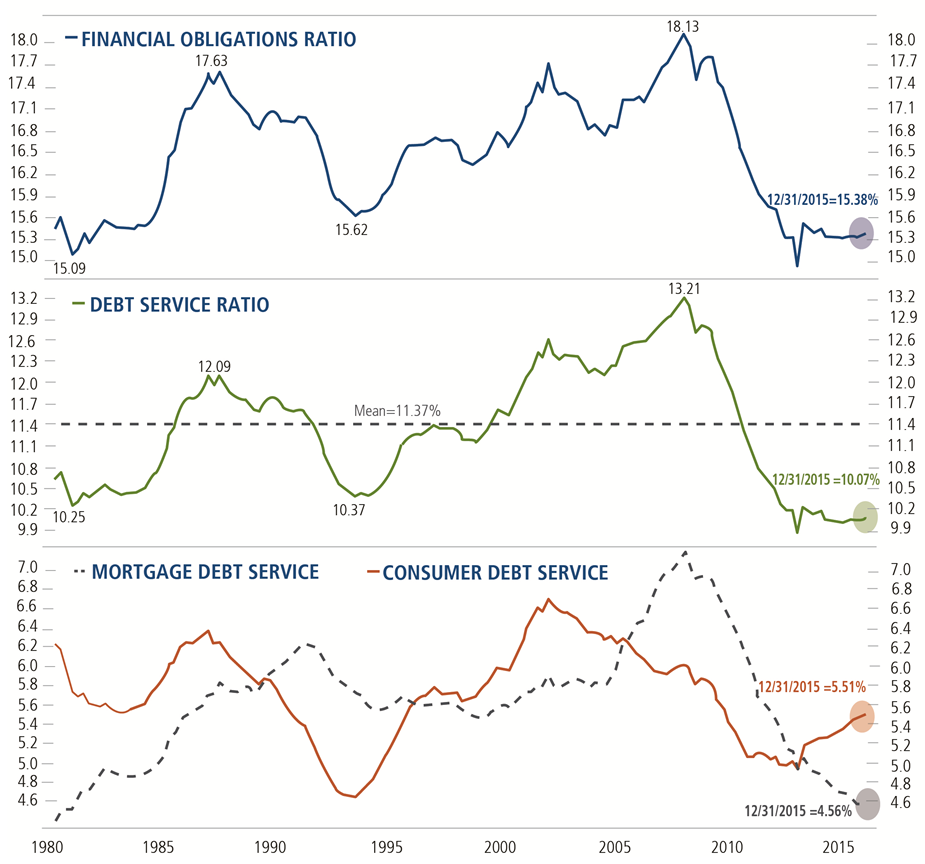
Source: Ned Davis Research using data from the Federal Reserve Board. Financial Obligations Ratio is an estimate of the ratio of debt payments to disposable income, and includes vehicle leases, rent, insurance, property taxes. Debt service ratio is minimum debt service payment on mortgage debt and consumer credit as a % of disposable personal income. Copyright 2016 Ned Davis Research, Inc. Further distribution prohibited without prior permission. All Rights Reserved. See NDR Disclaimer at www.ndr.com/copyright.html. For data vendor disclaimers refer to www.ndr.com/vendorinfo/.
* Definition of “Beautiful De-Leveraging” by Ray Dalio of Bridgewater: “A beautiful deleveraging balances three options. In other words, there is a certain amount of austerity, there is a certain amount of debt restructuring, and there is a certain amount of printing of money. When done in the right mix, it isn't dramatic. It doesn't produce too much deflation or too much depression. There is slow growth, but it is positive slow growth. At the same time, ratios of debt-to-incomes go down. That's a beautiful deleveraging.”
On the other hand, government debt appears very high, in part because the unsustainable indebtedness of 2008 was transferred from the private to the government sector where it could be more easily sustained with lower interest rates and longer maturities. Figure 2 highlights that U.S. Federal debt remains unusually high relative to GDP, although the cost of servicing this debt is near generational lows, at about 13% of U.S. tax revenues.
Figure 2. Government Debt (Federal, State, Local) + GSE Debt as a % of GDP Quarterly Data, 3/31/1947 to 12/31/2015, Log Scale
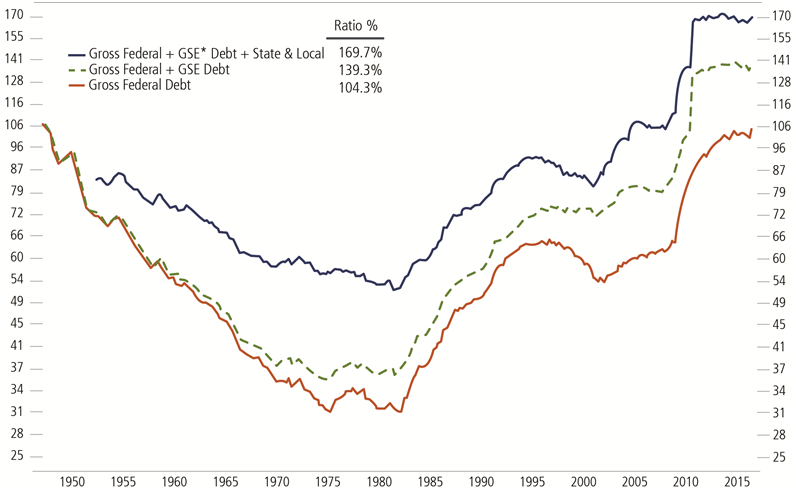
GSE: Government sponsored enterprises, e.g., Fannie Mae, Freddie Mac. Source: Ned Davis Research using data from the Federal Reserve. Copyright 2016 Ned Davis Research, Inc. Further distribution prohibited without prior permission. All Rights Reserved. See NDR Disclaimer at www.ndr.com/copyright.html. For data vendor disclaimers refer to www.ndr.com/vendorinfo/.
The silver lining for government debt has been the policies of quantitative easing (QE), whereby the central bank replaces (i.e., purchases in the open market) an interest-bearing government bond with cash. Technically, the government bond still exists and the interest payments remain due. But now, the central bank owns the bond (rather than the private sector) and receives the interest payments. At the end of the year, the central bank hands over its “interest profits” back to the government. In essence, the government is paying interest to itself.
Practically speaking, government debt that is held by the central banks has disappeared and been replaced with cash or currency in circulation. The long-term implications of this are unknown and bear monitoring. But for governments, the immediate attraction is simple: Currency in my wallet does not pay interest and has no maturity date. In effect, government debt has been monetized by the central bank’s willingness to “print money.”
This implies that we should adjust our analysis of government debt to focus on the debt that is actually held by the private sector rather than held by the central bank. When we do this, we see a different picture. As Figure 3 highlights, true debt-to-GDP levels of the major governments have stabilized and in some instances declined in recent years.
Figure 3. QE’s Beautiful De-Leveraging Quarterly Data, 3/31/1998 to 3/31/2016
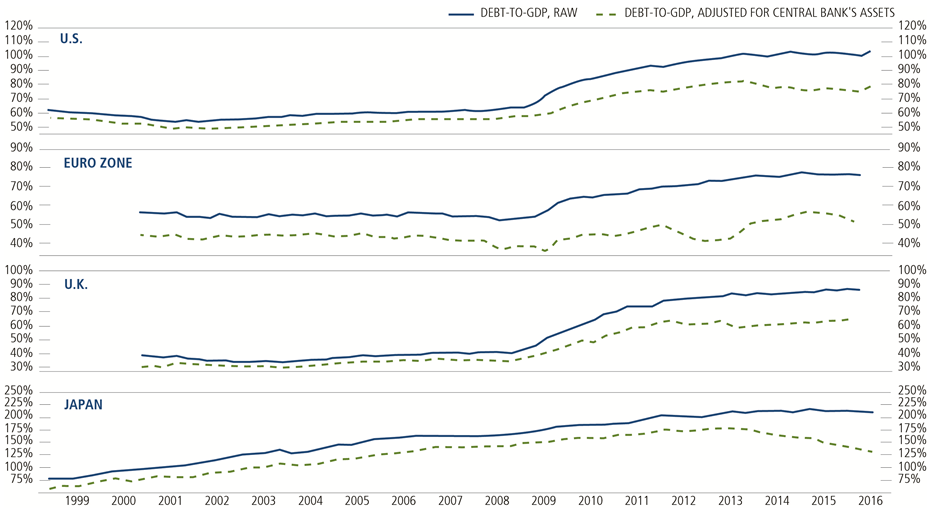
Debt-to-GDP ratio is the ratio of a country’s national debt to its gross domestic product. Source: Ned Davis Research using Haver Analytics. Copyright 2016 Ned Davis Research, Inc. Further distribution prohibited without prior permission. All Rights Reserved. See NDR Disclaimer at www.ndr.com/copyright.html. For data vendor disclaimers refer to www.ndr.com/vendorinfo/.
When this adjusted perspective is combined with today’s low interest rates, one conclusion is that concerns over government debt levels are entirely political rather than economic. From an economic viewpoint, the debt has never been easier to service. In Europe’s case and assuming the European Central Bank fulfills its QE promises, the euro zone’s adjusted debt levels will soon decline to 40% of GDP—hardly a level of concern!
What is the implication for equities?
The major debate today is the speed and sustainability of the economic expansion. This analysis suggests that debt fears should be less of that debate—it is time to move on. The developed economies are gradually completing their great deleveraging and $8 trillion dollars of debt has effectively disappeared.