Investment Ideas Home Page
Why and How to Find Growth Overseas—CIGIX
June 20, 2024
Why pursue growth overseas?
- Growth matters everywhere
- Growth overseas is scarce but important
- Relative valuations are attractive
Growth Matters
Over the long term and across regions, companies with the highest growth metrics have historically outperformed lower-growth companies by a significant margin. As shown below, companies in quintile one with the highest growth have notably outperformed companies in quintile five over the trailing 10-year period.
Trailing 10-Year Annualized Return by Growth Quintile
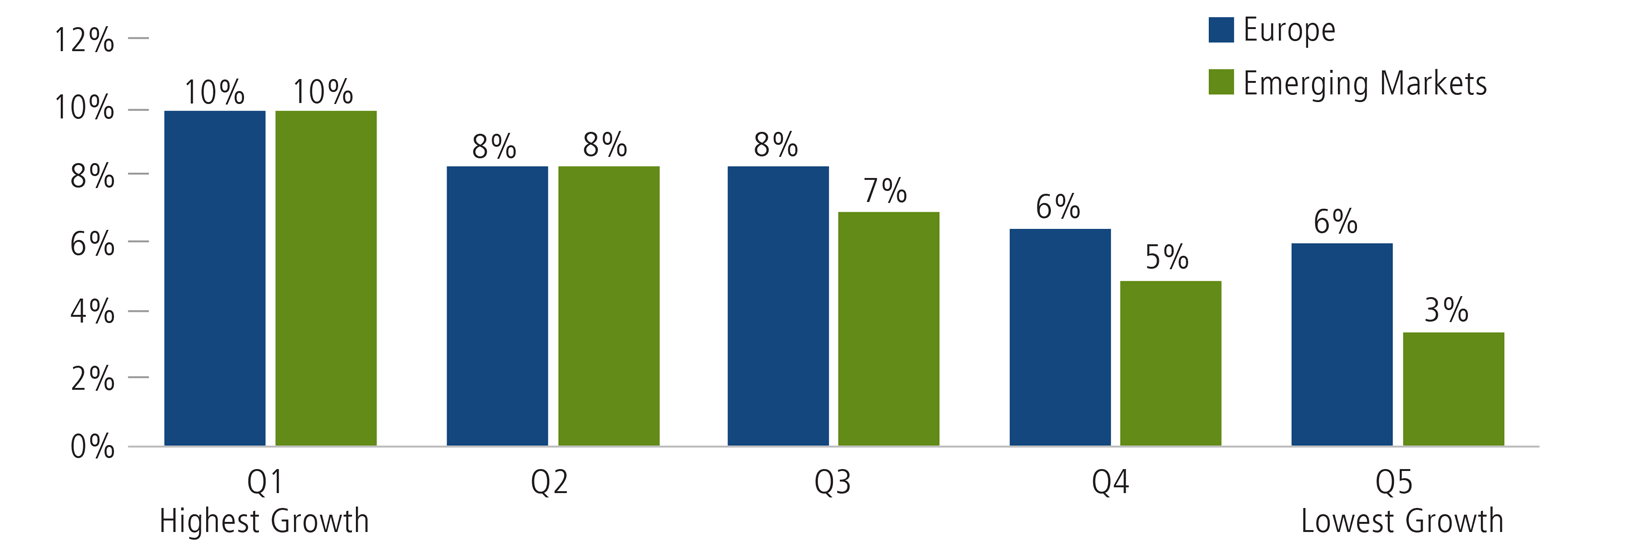
Past performance is no guarantee of future results. Source: Calamos Investments using internal data. Data represents the annualized returns for the trailing 10-year period ended April 30, 2024. Securities are grouped by their historical growth, which is defined as a proprietary blend of earnings growth, cash-flow growth, and revenue growth.
Growth Overseas Is Scarce
International markets are mostly made up of cyclical and defensive stocks and lack secular growth. Essentially, core outside the US has a similar composition to Value in the US.
From a return perspective, the core MSCI ACWI Ex USA Index has a 0.9 correlation to the US focused Russell 1000 Value Index over the trailing 20 years. This means that true international growth companies provide an important means of diversification–although it takes an experienced, active manager to discern them.
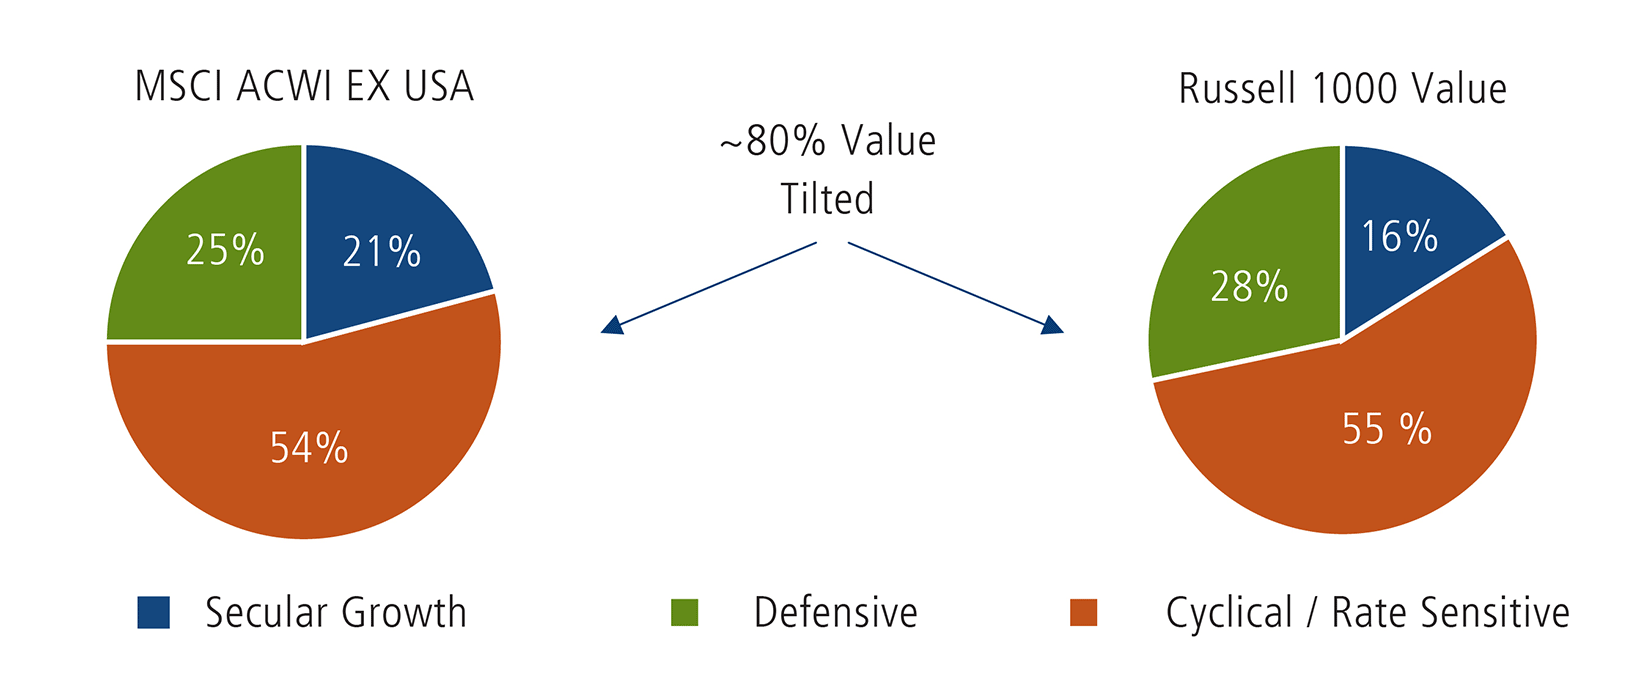
Source: calculated by Calamos Investments using data from Morningstar Direct as of 5/31/2024.
Relative Valuations Are Attractive
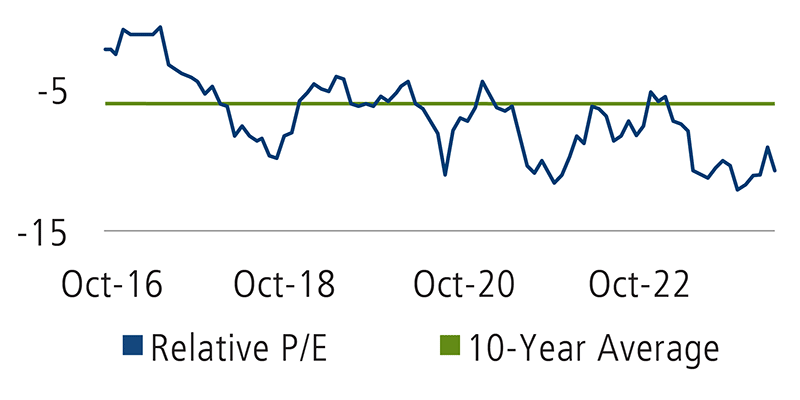
While international growth stocks typically trade at a discount to US growth stocks, the current discount is its widest in the past decade, making this potentially a good time to buy in.
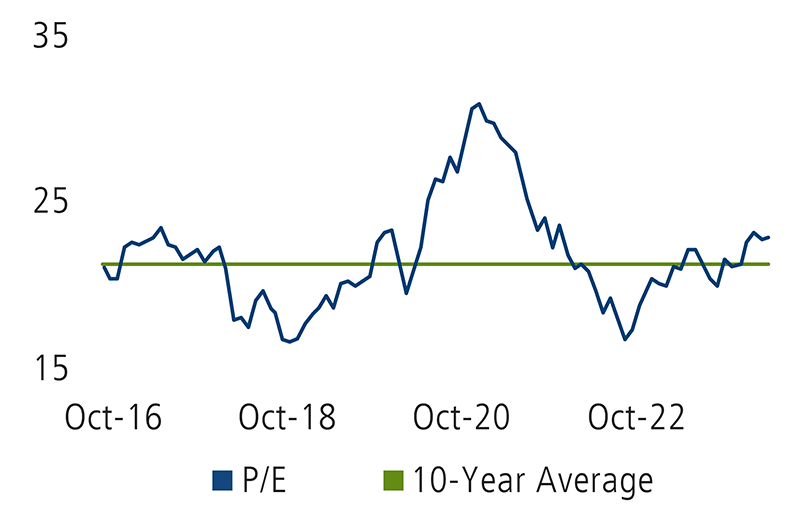
Also, even after the recent market rally, international growth equity valuations have only returned to their long-term average when compared to their own history.
P/E of MSCI ACWI EX USA Growth Relative to Russell 1000 Growth
P/E of MSCI ACWI EX USA Growth
Source: Morningstar Direct as 5/31/2024. Data references trailing P/E.
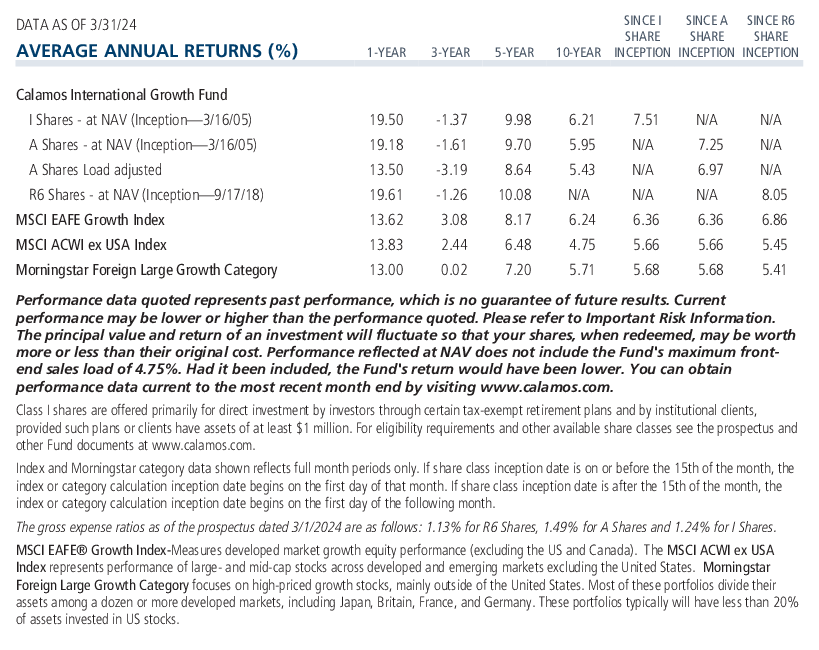
Calamos International Growth Fund
With a high-conviction approach focused on high-quality, market-leading international growth companies, the Calamos International Growth Fund (CIGIX) has consistently outperformed its benchmark and peers.
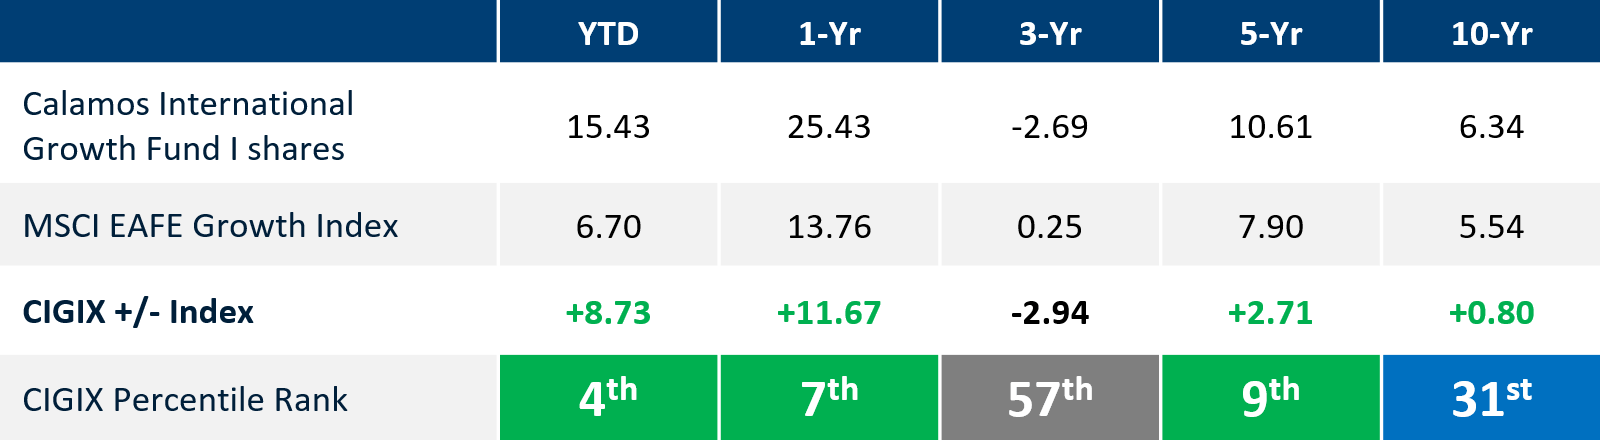
Past performance is no guarantee of future results. Source: Morningstar Direct as 5/31/2024.
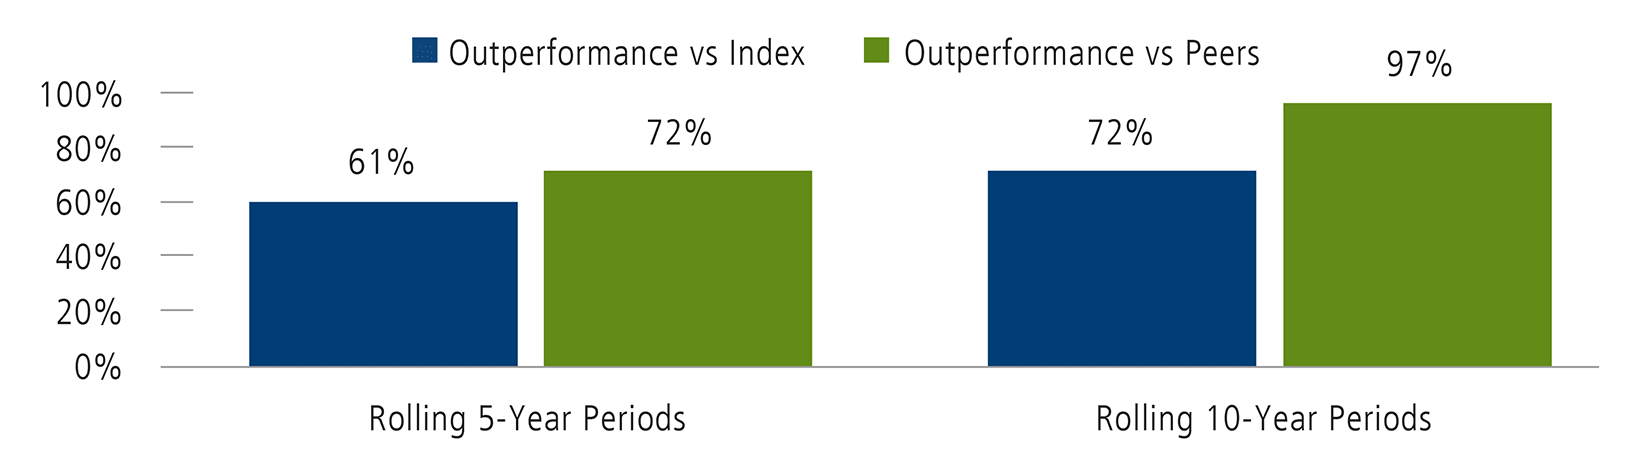
Consistent Historical Outperformance
CIGIX Rolling Outperformance
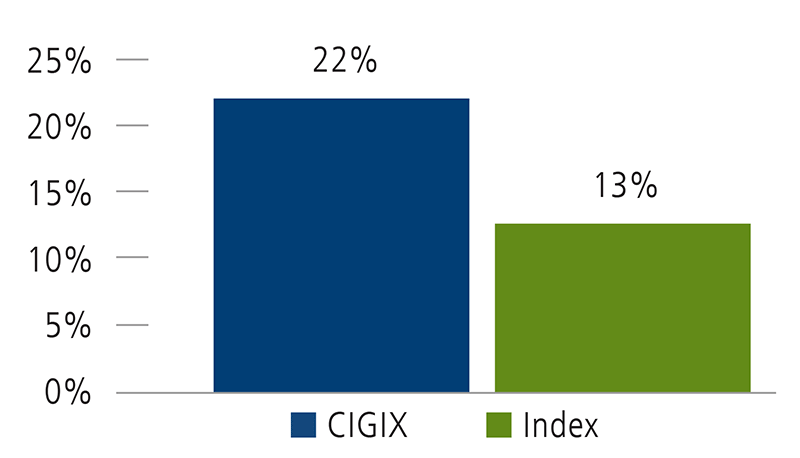
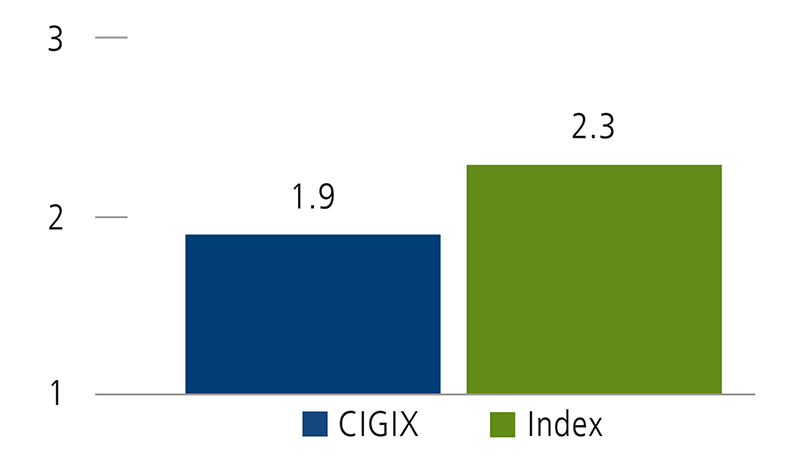
Strong Earnings Growth & Attractive Valuations
Est. 5-Yr EPS Growth
PEG Ratio
Past performance is no guarantee of future results. Source: Calamos Investments as of 3/31/24.
To find out how Calamos International Growth Fund’s time-proven portfolio of fundamentally driven growth companies can enhance the capital appreciation of an international allocation, contact your Calamos Investment Consultant at 866-363-9219 or caminfo@calamos.com.
Before investing, carefully consider the fund’s investment objectives, risks, charges and expenses. Please see the prospectus and summary prospectus containing this and other information which can be obtained by calling 1-866-363-9219. Read it carefully before investing.
Opinions and estimates offered constitute our judgment and are subject to change without notice, as are statements of financial market trends, which are based on current market conditions. We believe the information provided here is reliable, but do not warrant its accuracy or completeness. This material is not intended as an offer or solicitation for the purchase or sale of any financial instrument. The views and strategies described may not be suitable for all investors. This material has been prepared for informational purposes only, and is not intended to provide, and should not be relied on for accounting, legal or tax advice. References to future returns are not promises or even estimates of actual returns a client portfolio may achieve. Any forecasts contained herein are for illustrative purposes only and are not to be relied upon as advice or interpreted as a recommendation.
Important risk information. An investment in the Fund(s) is subject to risks, and you could lose money on your investment in the Fund(s). There can be no assurance that the Fund(s) will achieve its investment objective. Your investment in the Fund(s) is not a deposit in a bank and is not insured or guaranteed by the Federal Deposit Insurance Corporation (FDIC) or any other government agency. The risks associated with an investment in the Fund(s) can increase during times of significant market volatility. The Fund(s) also has specific principal risks, which are described below. More detailed information regarding these risks can be found in the Fund’s prospectus.
The principal risks of investing in the Calamos International Growth Fund include equity securities risk consisting of market prices declining in general, growth stock risk consisting of potential increased volatility due to securities trading at higher multiples, foreign securities risk, emerging markets risk, small and mid-sized company risk and portfolio selection risk. As a result of political or economic instability in foreign countries, there can be special risks associated with investing in foreign securities, including fluctuations in currency exchange rates, increased price volatility and difficulty obtaining information. In addition, emerging markets may present additional risk due to potential for greater economic and political instability in less developed countries.
The MSCI ACWI ex USA Index represents performance of large and mid-cap stocks across developed and emerging markets excluding the United States. The MSCI ACWI ex USA Growth Index represents performance of large and mid-cap stocks exhibiting growth style characteristics across developed and emerging markets excluding the United States. The Russell 1000 Value Index measures the performance of the large-cap value segment of the US equity universe. It includes those Russell 1000® companies with lower price-to-value ratios and lower forecasted growth values. The Russell 1000® Value Index is published and maintained by FTSE Russell.
PEG ratio is a stock's price/earnings ratio divided by the estimated earnings growth rate in the next year; a lower PEG indicates that less is being paid for each unit of earnings growth. Price/earnings (P/E) ratio is the current stock price over the trailing 12-month earnings per share. A higher P/E ratio typically indicates higher market expectations for future growth. A lower P/E ratio might indicate that a stock is undervalued.
900207 0624